It’s good to check simulations against measurement sometimes to ensure all is well. Here is a nice result 🙂
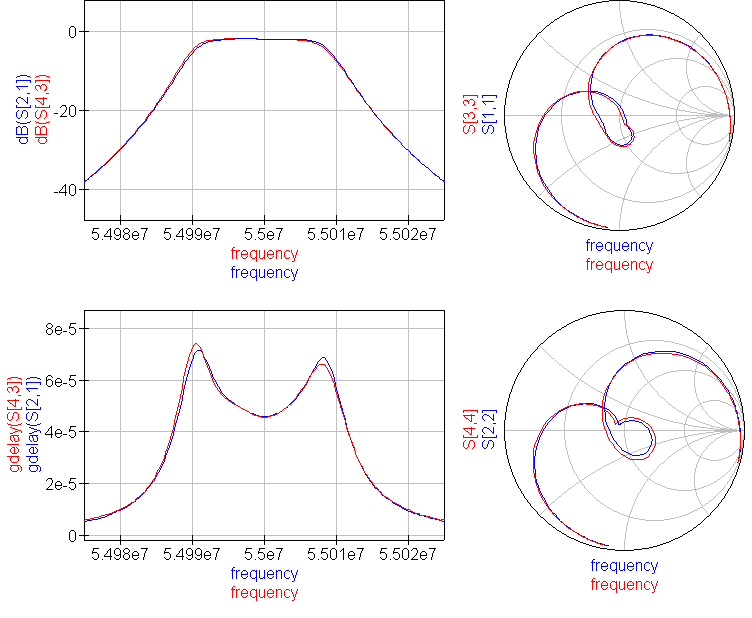
The blue traces are from direct measurement, and the red from measurement of smaller elements combined in simulation. Read on for more detail.
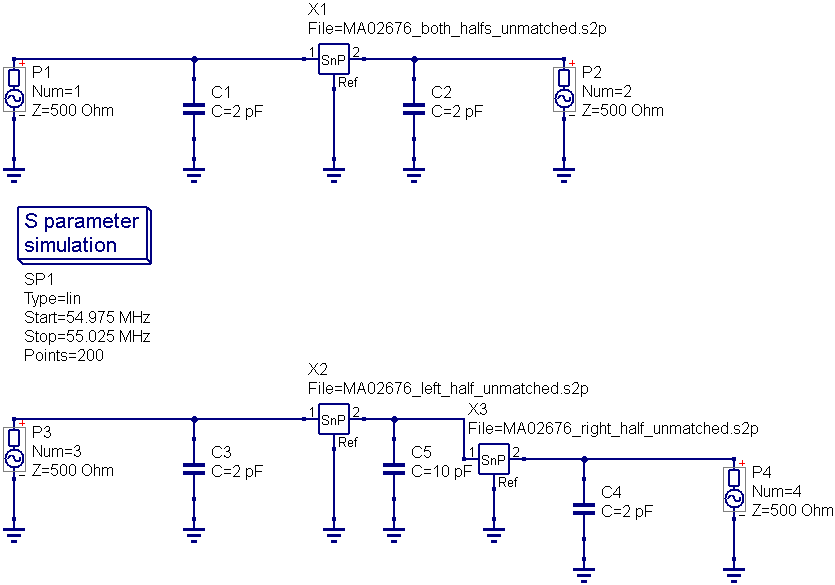
What I was checking today was two approaches to generating characteristic plots of a 4 pole crystal filter. The filter comes split into 2 separate 3-leg UM1 packages. Its a 15kHz wide (-3dB) filter centred on 55MHz. The termination impedance is 500 ohms in parallel with 2pF. The filter requires the user to provide a 10pF shunt capacitor at the junction of the two parts. This arrangement is a right pain in production, but common in the industry, fortunately now being superseded by advanced packaging techniques that can accommodate the two quartz blanks in a single surface mount package.
The method of measuring crystal filters I have been using recently is to measure the S-Parameters of the unmatched filter using the 450 ohm vector network analyser (VNA) I developed at Golledge. The 450 ohm normalised S-Parameter data can then be analysed in a circuit simulator with the termination impedances set as required for the crystal filter. 450 ohms is used in place of the conventional 50 ohms as it is closer to the working impedances of crystal filters, usually in the range 300 ohms to 3k ohms. Measurements in 50 ohms are not accurate enough.
What I was comparing today was approach 2) measuring the two packages of the crystal filter separately then combining them along with an ideal centre coupling capacitor, with approach 1) measuring the two packages connected with a ceramic centre coupling capacitor as a single filter.
Here is the simulation running both approaches
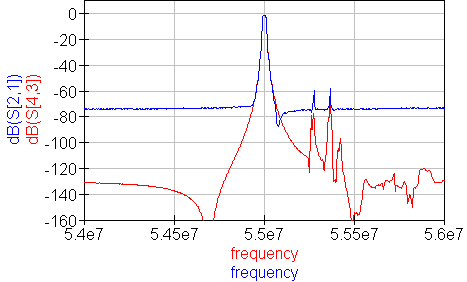
The separate package approach has benefits when measuring the stopband as test fixture stopband leakage is less of a problem.
Files
For those who want to look further into this here are the S-parameters and QucsStudio files.